It has been more than a year since discussions of the Texas Electricity Grid grabbed headlines as winter storm Uri brought national focus to Texas’ electric system. In our second episode, we identify the opportunities and challenges of lowering carbon emissions by introducing a significant amount of renewable electric generation into the mix.
As we continue to see renewable resources—primarily wind and solar—replace carbon-emitting resources and lAs intermittent renewable resources – primarily wind and solar – replace carbon-emitting baseload like coal, there is increasing awareness of the reliance on resources like natural gas-fired generation that are flexible and capable of ramping to balance variable demand and generation.
The Model
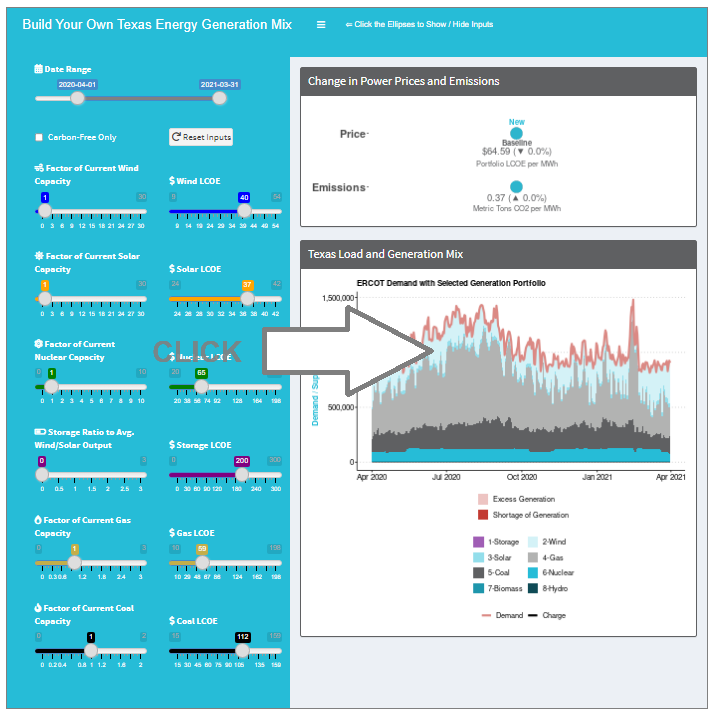
Using our model, we run a “reduced-carbon” scenario, shutting all coal-fired generation and increasing wind by 3.75 times current levels. In this scenario, natural gas-fired generation remains critical for balancing but becomes more of an intermittent and peaking generation resource. We will see the following observations of this “reduced-carbon” scenario:
- Carbon emissions are reduced by approximately 74%
- Land usage increases significantly (from land requirements for 37 Washington, DCs to 102)
- LCOE is reduced by 16.5%
- Excess energy is created for some extended periods (see light-red-shaded areas)
- Natural gas-fired generation falls significantly as renewables fill the gap.
- But there are two periods of three days where significant renewables shortfalls (see dark, red-shaded areas) emerge over the April 2021 to August 2021 analysis period requiring the significant natural gas capacity to meet demand (80% maximum daily supply)
If we extend the analysis period from August 2020 to August 2021, the “reduced-carbon” scenario’s results are not significantly different from the baseline period. One key observation is that natural gas-fired generation hits its 100% capacity limit seven times during the one-year analysis period at one million MWhrs. Why is this observation important when building a future energy generation mix?
Key Implications from the “Reduced-Carbon” Scenario
- There are extended periods, greater than one week on dates outside of winter storm Uri, where renewable supply shortfalls would have challenged grid reliability (e.g., September 2020, July 2021, August 2021). This is important because while the energy shortage during winter storm Uri has received the most attention, it is not unique. There are other times throughout the analysis period where grid reliability would have been similarly challenged.
- It is important to consider that we would need to maintain the same gas-fired-generation infrastructure (i.e., plants, pipelines) that we have today and build out renewable energy generation by 3.75 times. This scenario would require significant up-front or fixed investment in renewables and include the cost to operate and maintain a similar capacity of gas-fired plants and pipelines.
- The gas-fired-generation plants we have today will need to transition from longer-cycle generation plants (i.e., combined cycle) to “peaker” generation plants (i.e., combustion turbine). This is costlier and less reliable as gas plants run fewer days but must ramp to full capacity on some days.
- The periodic renewable shortfalls highlight the limitations of a 100% renewable solution to zero carbon goals. Natural gas capacity will continue to be critical. Even though natural gas-fired generation falls from approximately 43% to approximately 22% of annualized supply, there are times when it is relied on for 85% of daily demand.
- One solution to the renewable shortfalls is for generation sources that have similar operating characteristics to baseload generation which operates carbon-free. This could open the door for advanced nuclear. (We will discuss this topic in upcoming episodes.)
- The excess generation supplied in this scenario could support new and growing electric applications, such as cryptocurrency mining or electric vehicle growth.
How Can We Help?
- Education Sessions – Educate your leadership team on the implications of these trends to your service territory.
- Business and Strategic Planning – Support your organization’s strategic decisions around changing the energy generation mix.
- Integrated Resource Planning – Challenge your organization with different considerations for your current integrated resource plan.
- O&M Analysis – Help you analyze the operating and maintenance cost of changing the operating profile of your gas plants from “peakers” to baseload.
- Regulatory Policy and Strategy – Support the development of a regulatory strategy that considers changes in your planned generation mix.
Model Methodology:
- Collected capacity from March 2021 (from ERCOT), by generation source (e.g., nuclear, natural gas, etc.)
- Calculated daily capacity factor, by generation source
- Calculated total generation by generation source based on the daily capacity factor
- Assumed Energy storage (batteries) are charged using energy from renewable resources; when all battery charging is complete, any additional energy beyond that needed to meet demand is deemed excess energy
- Energy storage is sized based on the average output of solar and wind, i.e., when a selection of 1 on the capacity toggle, and the average daily output of solar and wind is 250,000 MWh there would be a storage capacity of 250,000 MWh
- Demand is implied by total historical generation but could have been higher in select periods (e.g., Winter Storm Uri) due to imports or demand response
- Generation cost by generation source is based on Lazard’s October 2020 levelized cost of energy (LCOE) reflected in $ per MWh. LCOE refers to the estimates of the revenue required to build and operate a generator over a specified cost recovery period. Note that LCOE is highly dependent upon financing parameters (debt-equity mix, cost of capital, depreciation schedule), installed cost, and fuel costs. Lazard’s analysis, updated annually, is frequently used in industry discussions.
- Used NuScale forecasted LCOE of $65/MWh as per NuScale SMR Technology – An Ideal Solution for Repurposing U.S. Coal Plant Infrastructure and Revitalizing Communities, 2021
- The analysis excludes demand from distributed energy resources
- The analysis also excludes renewable integration costs from calculations of LCOE
- Generation includes proportionally larger technologies and not smaller (in % of total generation) technologies such as thermal peaking plants, hydropower, and biomass
- Cost of Storage is defined as the generation supplied by storage for a given day, multiplied by the per MWh LCOE price. We will cover different ways to apply the LCOE of storage in a future storage-focused episode
- Emissions are calculated using the following values, per EPA
- Coal: 2.21 lbs./kWh (20.3% of total baseline generation)
- Natural gas: 0.91 lbs./kWh (47.4% of total baseline generation)
- The goal of the model is to provide a simplistic view of energy-only characteristics to illustrate the what-if generation mixes and the impact on cost of energy and carbon emissions
- The analysis does not include the various detailed elements such as ramping non-variable fuel cost assumptions, price of energy- calculation
- Since this analysis uses daily data, it excludes any intraday changes or requirements of the generation mix such as charging or discharging batteries throughout the day
- The analysis considers current technology costs and does not consider changes in technology costs
- The carbon-free scenario considers a limited number of non-carbon generation resources (i.e., solar, nuclear, wind, and energy storage) and does not consider new technologies under development such as carbon capture and storage technologies
- Calculating specific wholesale electricity power prices would require a detailed system modeling


